Telemetry Dashboard

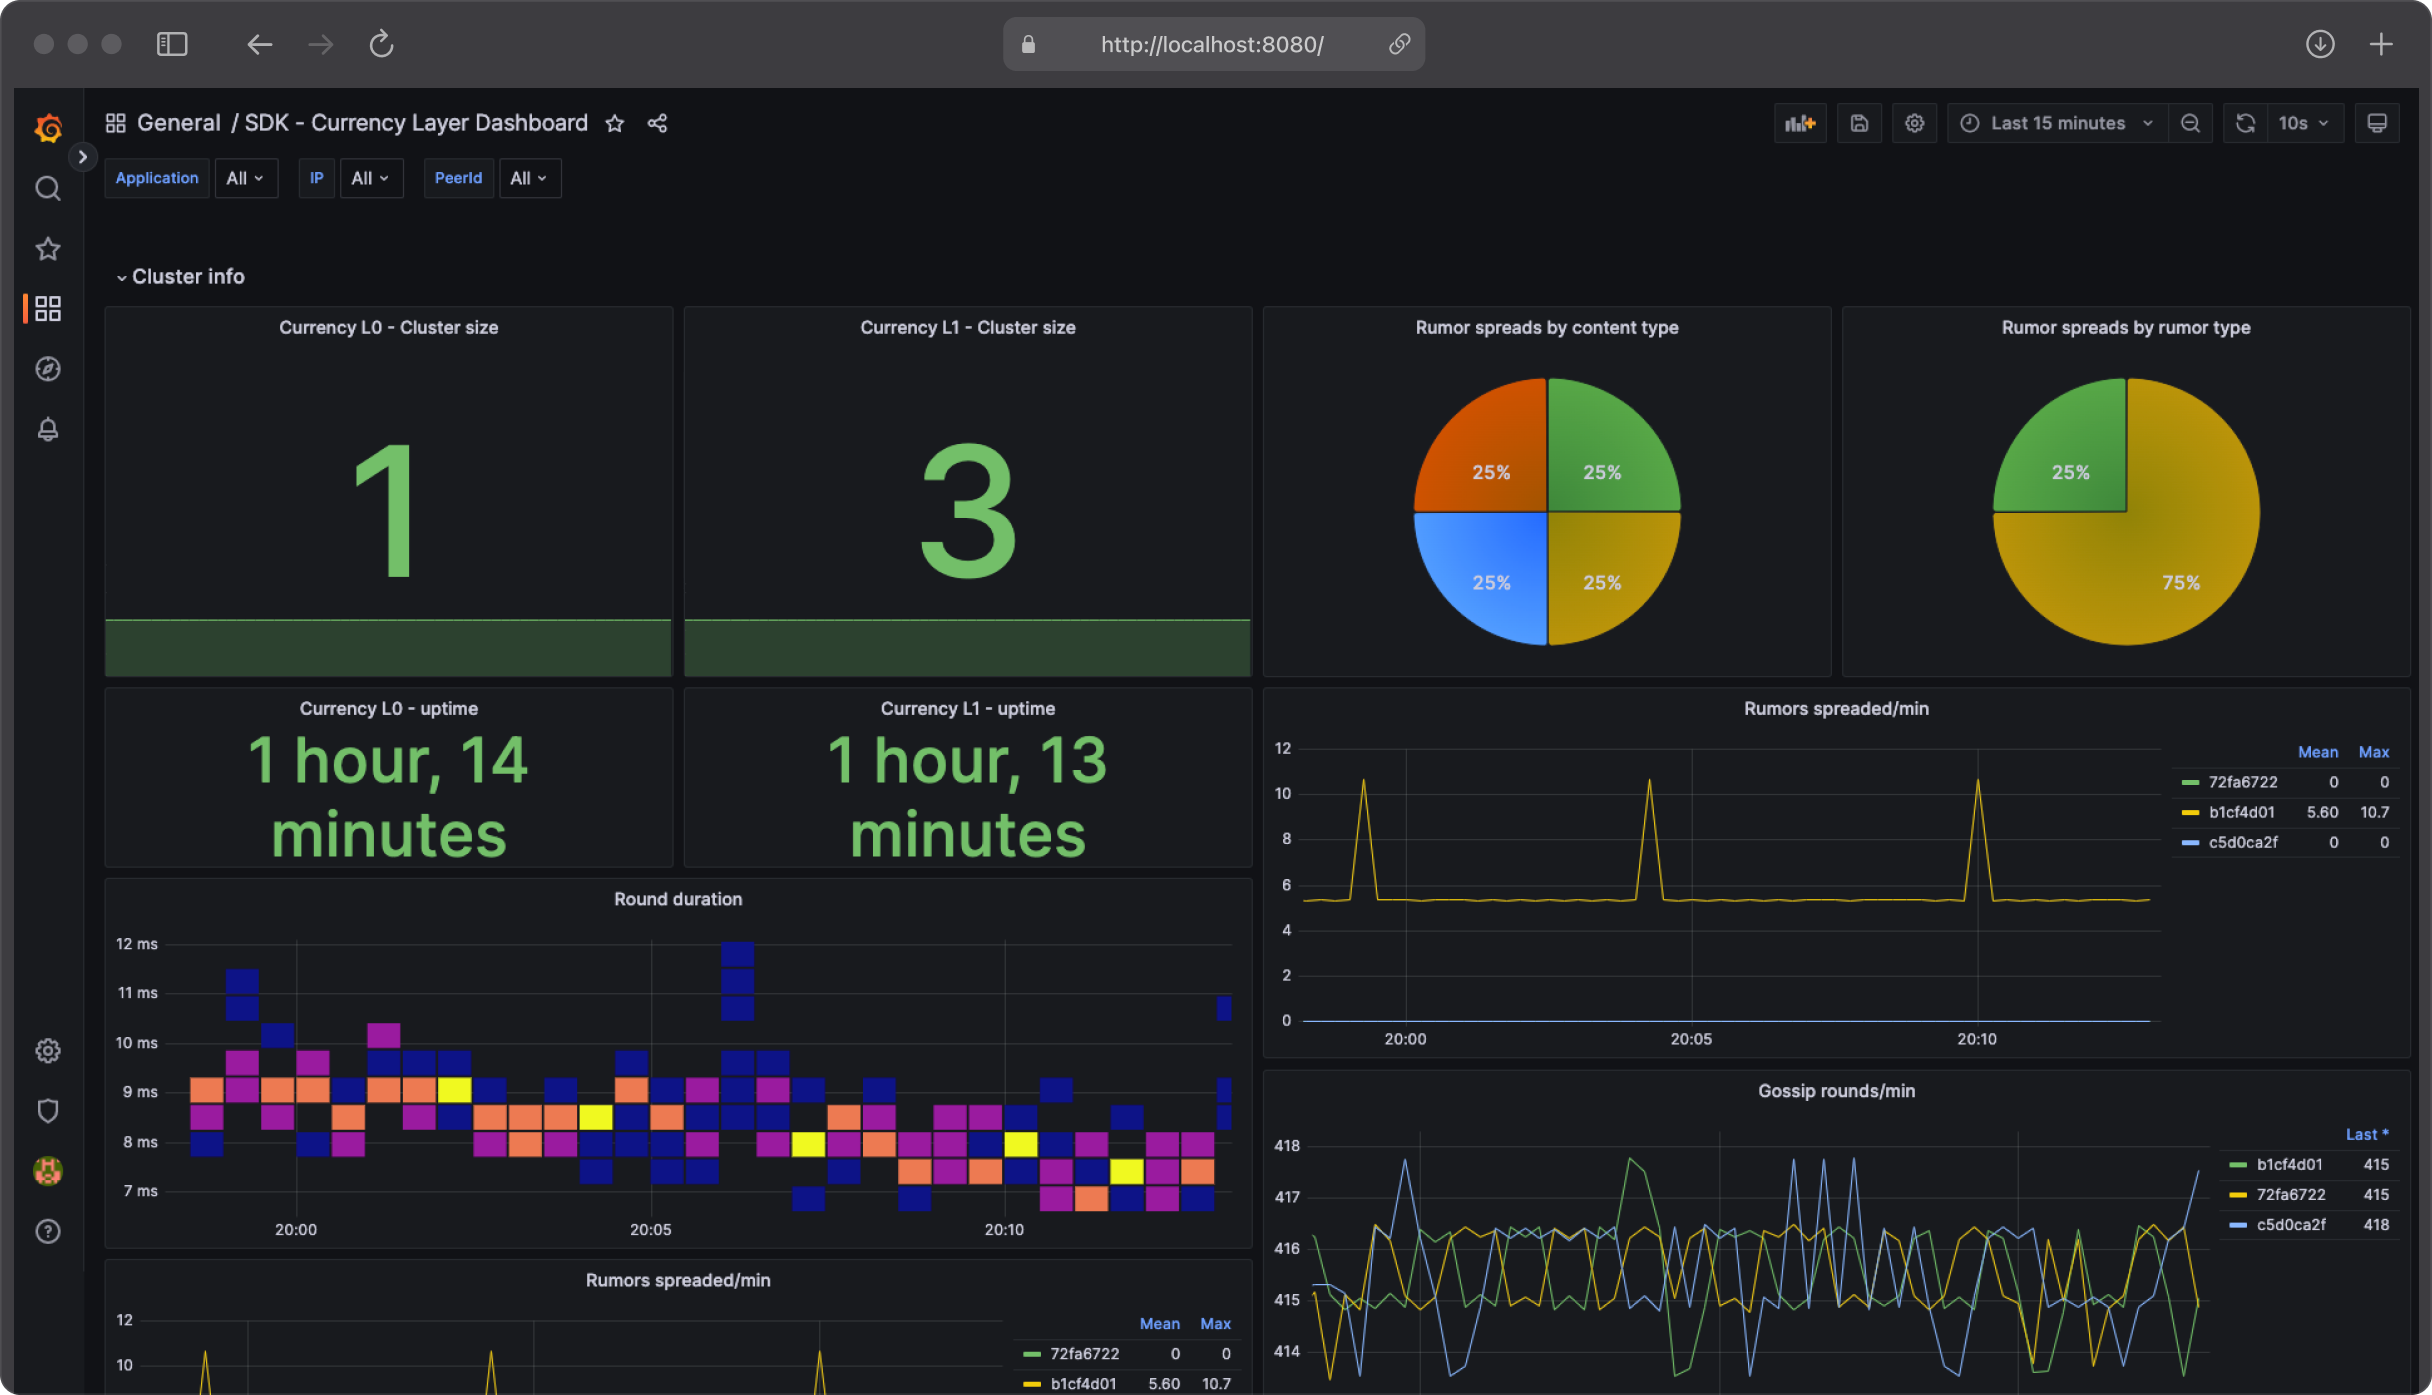
The Telemetry Dashboard is an essential tool provided as part of the SDK to allow project teams to monitor network health for metagraph development. It consists of dashboard templates to track global network health (Global L0 and DAG L1) and local metagraph health (Currency L0 and Currency L1). The Telemetry Dashboard is built on a Grafana instance using data collected from the network via Prometheus.
The dashboard provides a visual representation of network health and helps developers to quickly identify any issues or bottlenecks in the system. By monitoring key metrics such as consensus duration, gossip round frequency, and transaction throughput, developers can make informed decisions about how to optimize their metagraphs networks and improve overall performance.
Installation
The Telemetry dashboard is included as part of the Euclid Development Environment. Once the framework is installed, it can be started with Hydra.
To start the dashboard, ensure that the start_grafana_container option is enabled in euclid.json:
...
  "docker": {
    "start_grafana_container": true
  }
...
Then, you can initiate the system from genesis with the following command:
scripts/hydra start-genesis
Alternatively, to start from a rollback, execute:
scripts/hydra start-rollback
By default, Grafana runs on port 3000 and can be accessed at the following url
http://localhost:3000
Setup
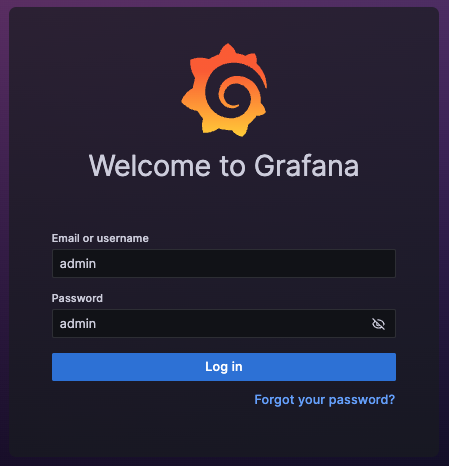
The default username and password both “admin”.

Dashboards
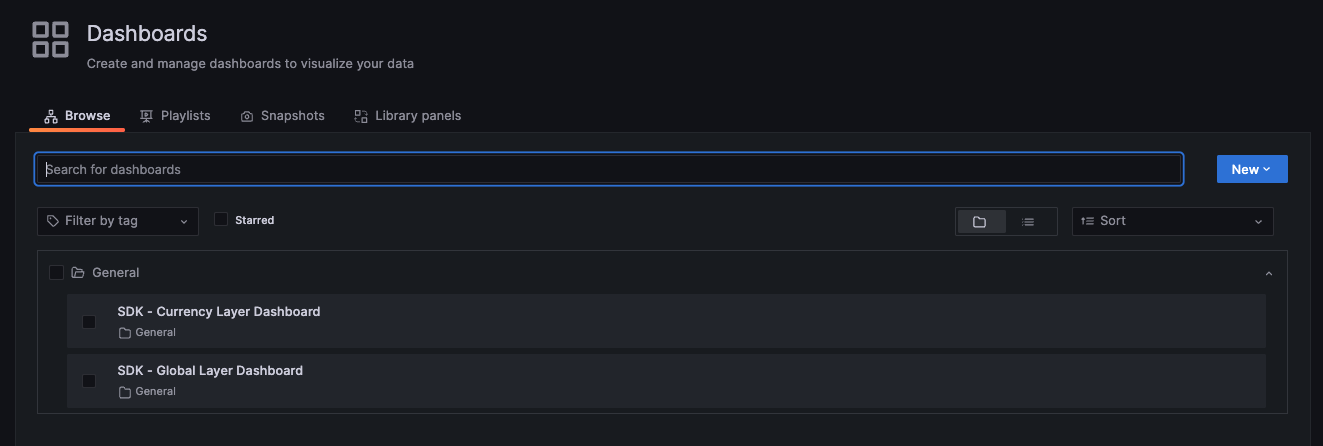
You can find the default dashboards in the “Dashboards” section on the left menu.

By default, the following templates are included:
- Global Layer dashboard - Information about the Global L0 and DAG L1 networks.
- Currency Layer dashboard - Information about the Currency L0 and Currency L1 networks.